
Continuous Automated Performance Testing
In BitBacker, I had serious performance requirements: if backups started taking 10% longer, I needed to know. I certainly wasn't going to notice from my day to day development because I wasn't doing large, multi-hour backup runs manually.
My solution was an automated system that iterated over the repository history, running a set of performance scripts for each revision. It then generated a plot of how long each benchmark took for each commit. It generated fancy plots like this (an actual screenshot taken in 2008):
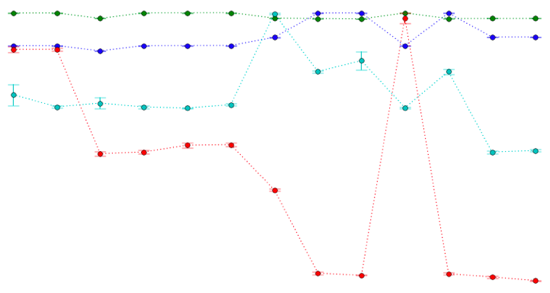
Each colored line is a particular performance metric, with runtime on the vertical axis and commits on the horizontal. The higher a data point, the slower the metric was for that revision. If you look closely, you'll also see error bars generated by running each metric multiple times. This ensured that the plots weren't lying to me.
The red line is how long a snapshot with 1,000 files takes. You can see that it got far slower at one point. Fortunately, seeing this graph made it obvious that I'd made a mistake, and I was able to fix it quickly. By the next sampled revision (ten actual revisions later), it was fixed.
This graph is also useful for verifying improvements. Before the red line gets slow, you can see a few big dips. These were periods of careful performance optimization, and this graph allowed me to remain objective about every performance improvement I introduced. It also kept me from becoming too focused on one metric to the detriment of another. If I optimized large backups, but accidentally made empty incremental backups slow, the graph would let me know.
BitBacker also had automated metrics for peak memory usage. Memory usage can be even trickier than runtime: you don't generally watch it while using the app, and the really nasty memory situations come from large, quick bursts of usage. These are even harder to gauge than runtime problems, but the performance graphs made them clear.
I've done development consulting on many projects since then, none of which had this type of analysis in place. Every time, I've wished that we were doing it, especially on the larger projects. I highly recommend the practice: it will keep performance regressions out of the hands of your users, and it will remove yet another source of stress from your development process.
(If you'd like to try this yourself, Destroy All software has a 13-minute screencast on the topic, in which we build a basic version from scratch with a few lines of RSpec and shell scripts.)